In today’s world we need insight into complicated questions whilst we are on the move. The phrase, ‘ask Google’ has become common parlance for “I don’t know” or “I can’t remember” and therefore need to ask for immediate insight.
This got me thinking about examples of mobile business intelligence. The UK government not only has ‘Digital First’ but also ‘Mobile First’ as a general policy, so the day of the App for all manner of access to information is without a shadow of a doubt upon us. When was the first time we had mobile Business Intelligence though? In a similar way to an early piece I wrote about the advent of Business Intelligence being in the 19th century I would suggest a really good early example of mobile Business Intelligece comes from the same city, London.
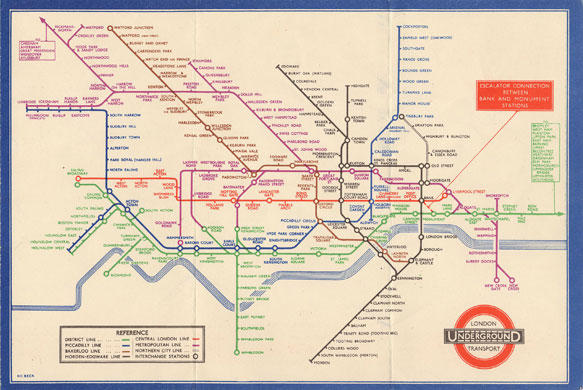
Is the London tube map one of the earliest examples of modern, mobile, business intelligence? The first ‘Tube Schematic’ by Harry Beck was published in 1931. Maps of the tube had been around since its inception. The first truly underground line opened in 1890 and separate maps dependant on the ‘owner’ of the line existed but in 1931, Beck, an employee of the London Underground, created the map that has become well known and copied the world over. Realising that the actual, above ground, geography of the tube stations did not matter once you were in the system Beck was able to create a graphic that could deliver insight wherever you were on the tube. A graphic that you could ‘drill down’ into to get to specifics and that you could take an overall ‘helicopter view’ of the system and make careful route decisions.
Beck, I think, could well have been one of the first brains in the world to create mobile Business Intelligence, but I doubt he knew it at the time. Setting himself some very simple rules, specific colours, straight lines with 45 degree breaks only and concepts around connecting stations, he was able to create a clean representation of over 269 interconnecting stations that cover 11 lines across the city of London.
All the concepts of modern, mobile Business Intelligence were captured in the map. A map for which Beck was paid only ten guineas (£580.35 in modern money) to produce could now be carried in the pocket of a traveller, who could, at a glance gain the insight they needed to make the shortest possible route through the London Underground. The information was indexed, valued (through a key showing the type of station) and offered a straight forward user experience. All of these points are elements that the Ventana Research Value Index: Mobile Business Intelligence for 2014 lists as essential for mobile Business Intelligence success,(these in full are; usability, manageability, reliability, capability and adaptability).
In delivering a mobile experience for Business Intelligence we have tried hard to replicate the desk bound experience for our Open Data Platform (ODP) Apps. Using the tools we have invested in, namely QlikView, we intend to replicate as much of the functionality that a user gets in the desk bound Apps. In setting strategy for this we have set ourselves three key statements:
Streamlined User experience – Whilst trying to replicate as much of the desk top functionality we also need to realise that a user on the go will need a streamlined experience. In some functionality cases this does reduce the functionality to drill ever further to build the insight, however the core functionality of the mobile version is to offer the capability to deliver root cause analysis to an immediate problem. Later in 2014, we will work with users to begin to consider how the user experience can be added to with a goal of attempting to move away from this statement and begin to deliver all of the desktop functionality to the mobile experience.
Extensible visualisation library – The mobile experience needs to offer as many different ways to get to the information and visualise it as the desk top version does. The key reason for this is that a principle attraction of the ODP Apps is the personalisation of the dashboards. Our user base has grasped this capability and utilises this for performance management monitoring in particular.
Off line deployment activity – Users are not online at all times, and the last thing anyone wants is to turn your table PC around to show someone the answer to discover that you are no longer on-line. With this in mind, the functionality to ensure insight gained on line can be ‘shared’ even though the mobile device may no longer be on line.
So back to the tube map, these three key statements work really well for the development too. The map has a streamlined user experience, you unfold it and can immediately get at the insight you need. The visualisation capabilities are appropriate, it can be personalised (with a pen) or cut up to represent only specific lines on the journey. Last but not least it certainly does have the kind of off line capability that is required, you can turn the insight around and share it with the person sat next to you.
Is the perfection of the tube map why it has been adopted in so many business intelligence environments as the front page to a series of applications I wonder?
Next time you are in London, check out the bottom right hand corner of the map where you will read the legend that is: “This diagram is an evolution of the original design conceived in 1931 by Harry Beck”, and then consider are you looking at the first mobile business intelligence app?